


With the launch of Databricks Lakehouse Monitoring in public preview late last year, customers have asked us where it fits in their data stack, especially in relation to Data Quality Monitoring platforms like Lightup.
We’ll walk through an overview of Lakehouse Monitoring and discuss where Lightup fits in for monitoring Data Quality and ensuring trusted data in Databricks and beyond.
After reading this blog, you’ll be able to answer these questions and more:
- Is Lakehouse Monitoring similar to or different from Lightup?
- What are the notable features and functionalities of each solution?
- How do I determine what to use for our organization and when?
What Is Databricks Lakehouse Monitoring?
Lakehouse Monitoring is a new native feature included in Databricks for premium and above licenses, allowing organizations to automatically monitor and track the quality of data for engineering pipelines and artificial intelligence (AI)/machine learning (ML) models to ensure dependable data and AI assets.
Purpose-built to monitor, debug, and optimize AI/ML models hosted in Databricks, Lakehouse Monitoring is fueled by Unity Catalog and allows MLOps teams to track changes in the quality of data feeding their models.
Small data engineering teams can also leverage Databricks Lakehouse Monitoring to monitor data pipelines in Databricks, built solely from Unity Catalog data.
How It Works
When a table monitor is created, Databricks automatically creates two metric tables, known as Delta tables (saved to the user-specified Unity Catalog schema), and a customizable dashboard visualizing the calculations.
Lakehouse Monitoring computes metric values for the full table, plus the user-defined time frames and “slices” or data subsets of the monitor.
- For table monitoring, create a monitor for a specified table in Databricks.
- For AI/ML model performance monitoring, create a monitor for an inference table containing the inputs and predictions of the model.
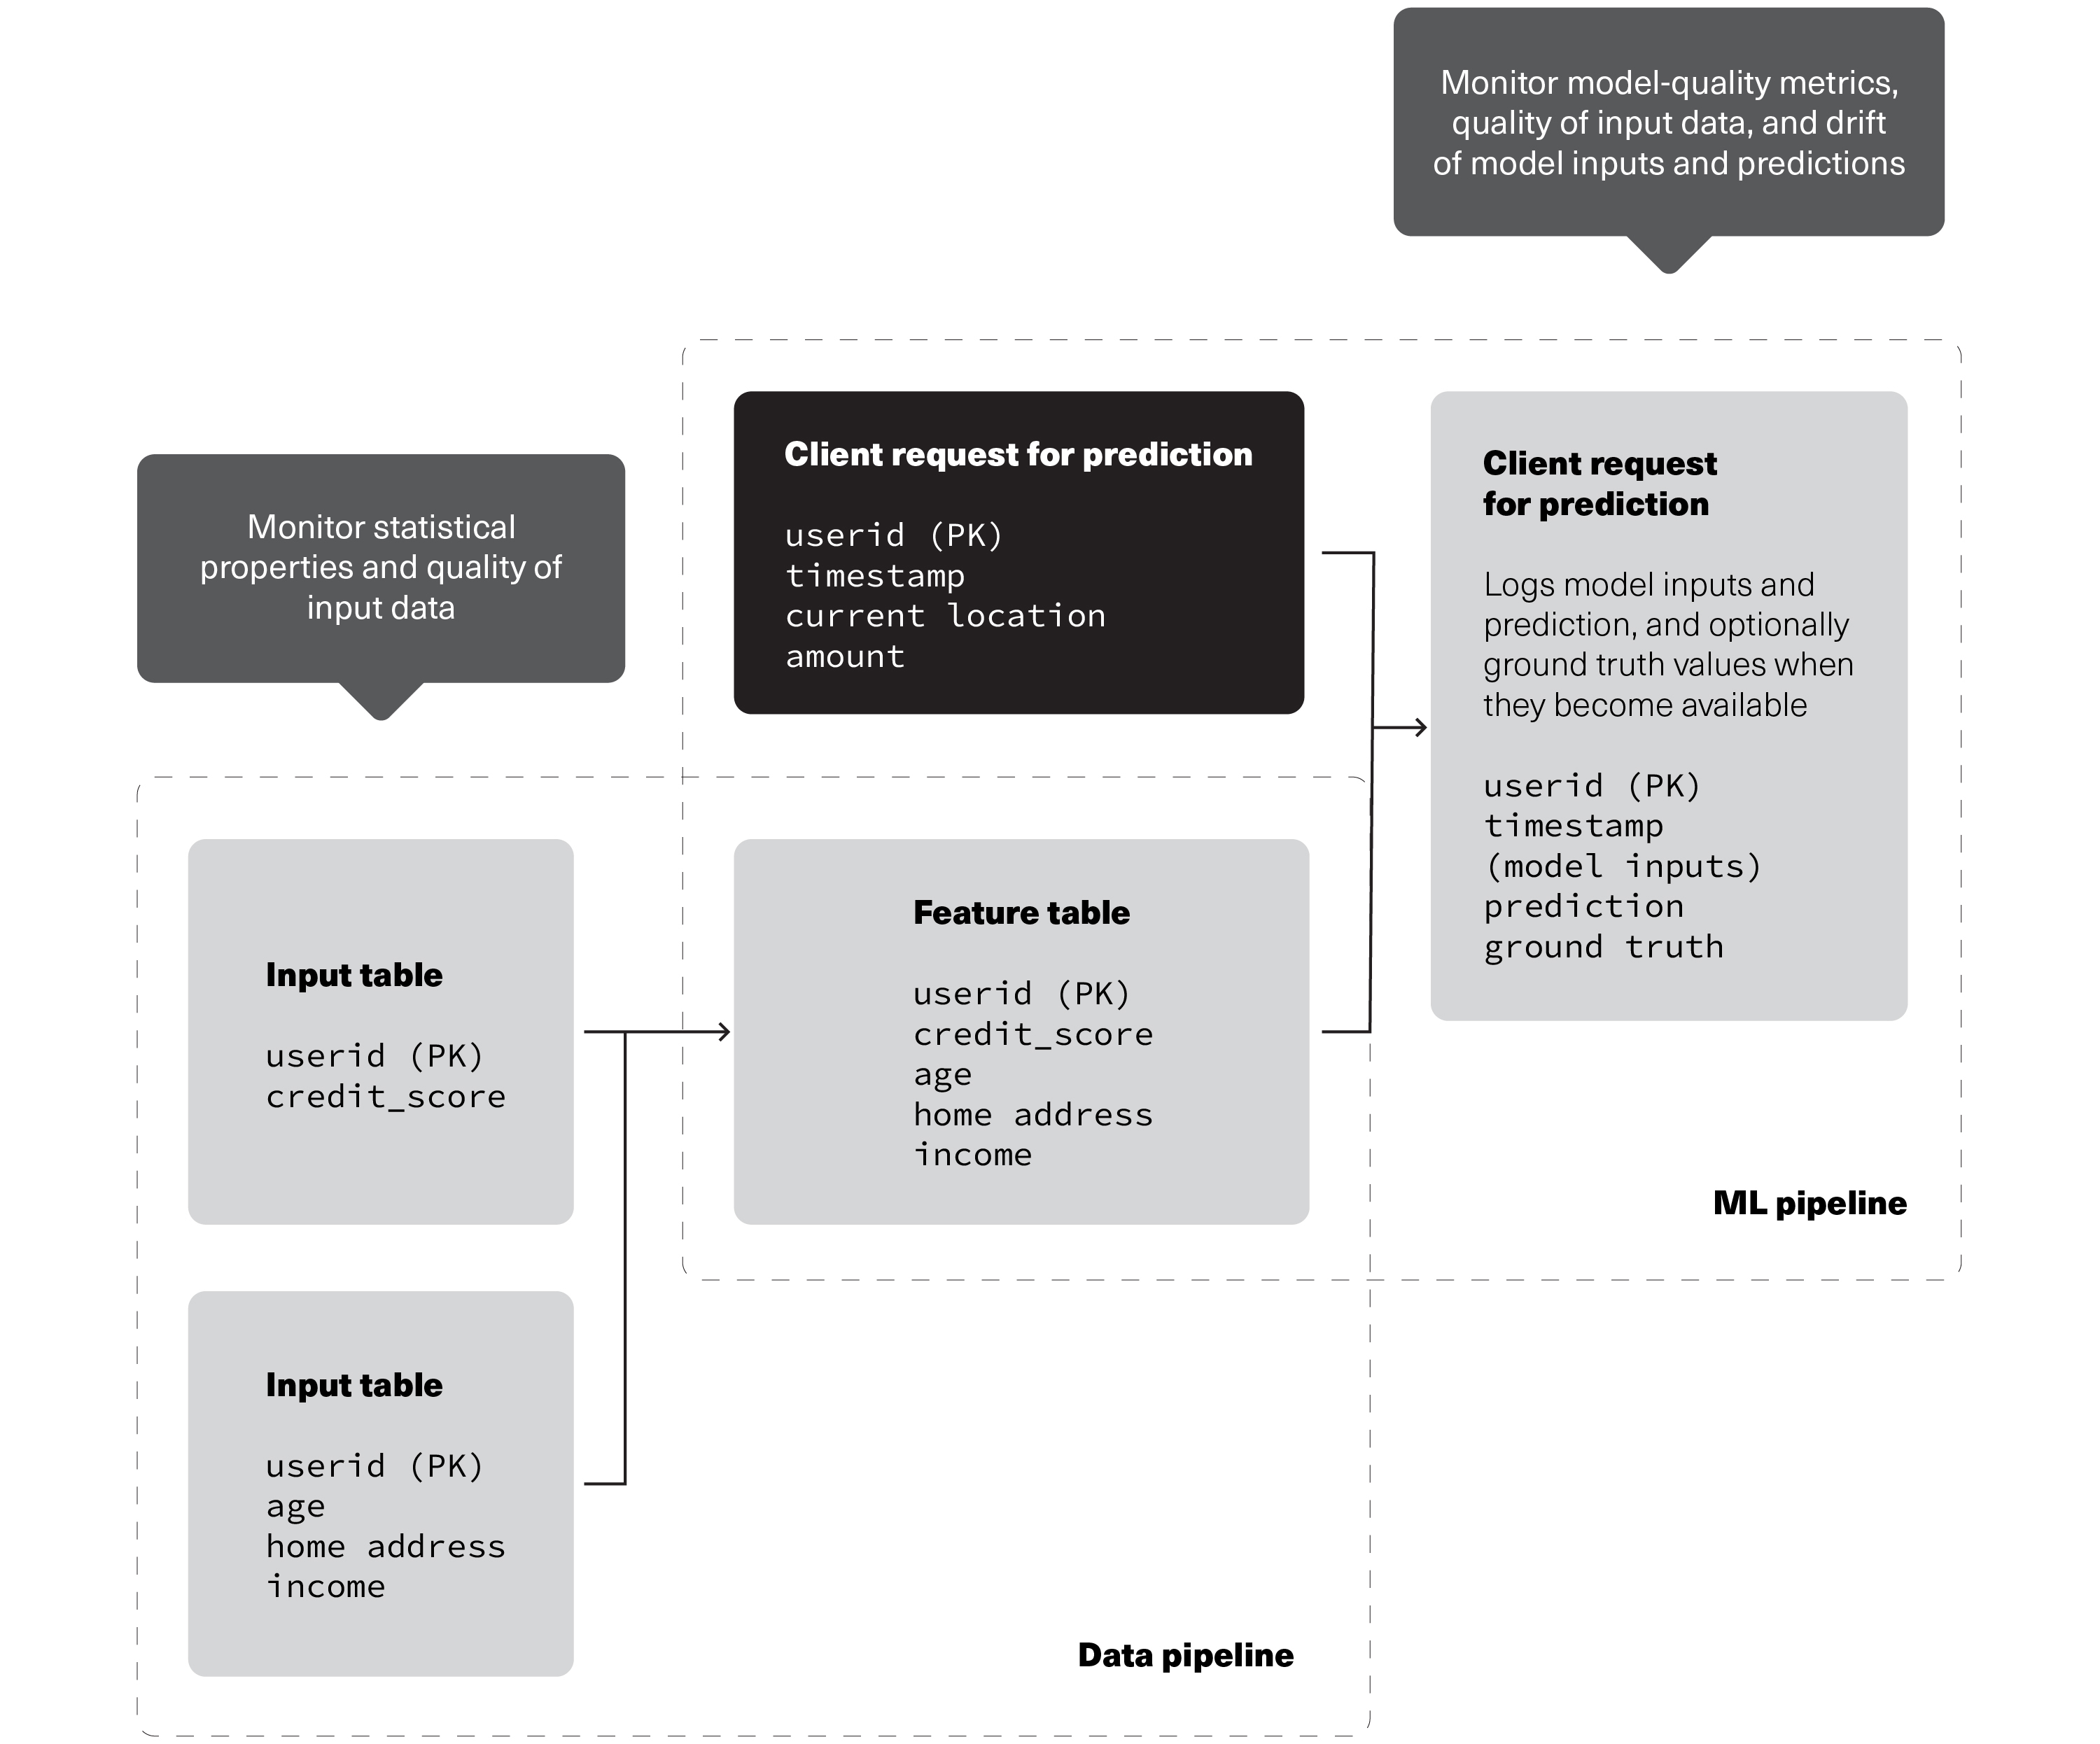
Source: Databricks
Monitoring recommendations to track the quality of data and model performance as data flows through data and ML pipelines in Databricks.
Lakehouse Monitoring includes three types of table analysis, called Profile Types:
- Time series*: Requires timestamp column to compare data distribution changes over specified time periods.
- Snapshot: Calculates metric changes for the full table over time, monitoring the entire state of the table at each refresh.
- Inference*: Similar to time series, with the addition of metrics to monitor model quality, inference tables store the output of predicted values by machine learning models, such as classification or regression. Additional columns unique to this table include: the model ID to calculate metrics on, model inputs or features, model predictions, and optional unique observation IDs, ground truth labels, and metadata for demographics.
*For time series or inference profile types, monitors can only look back a maximum of 30 days from the time of monitor creation. (In Lightup, standard metrics look back 90 days, configurable up to a maximum of 732 days.)
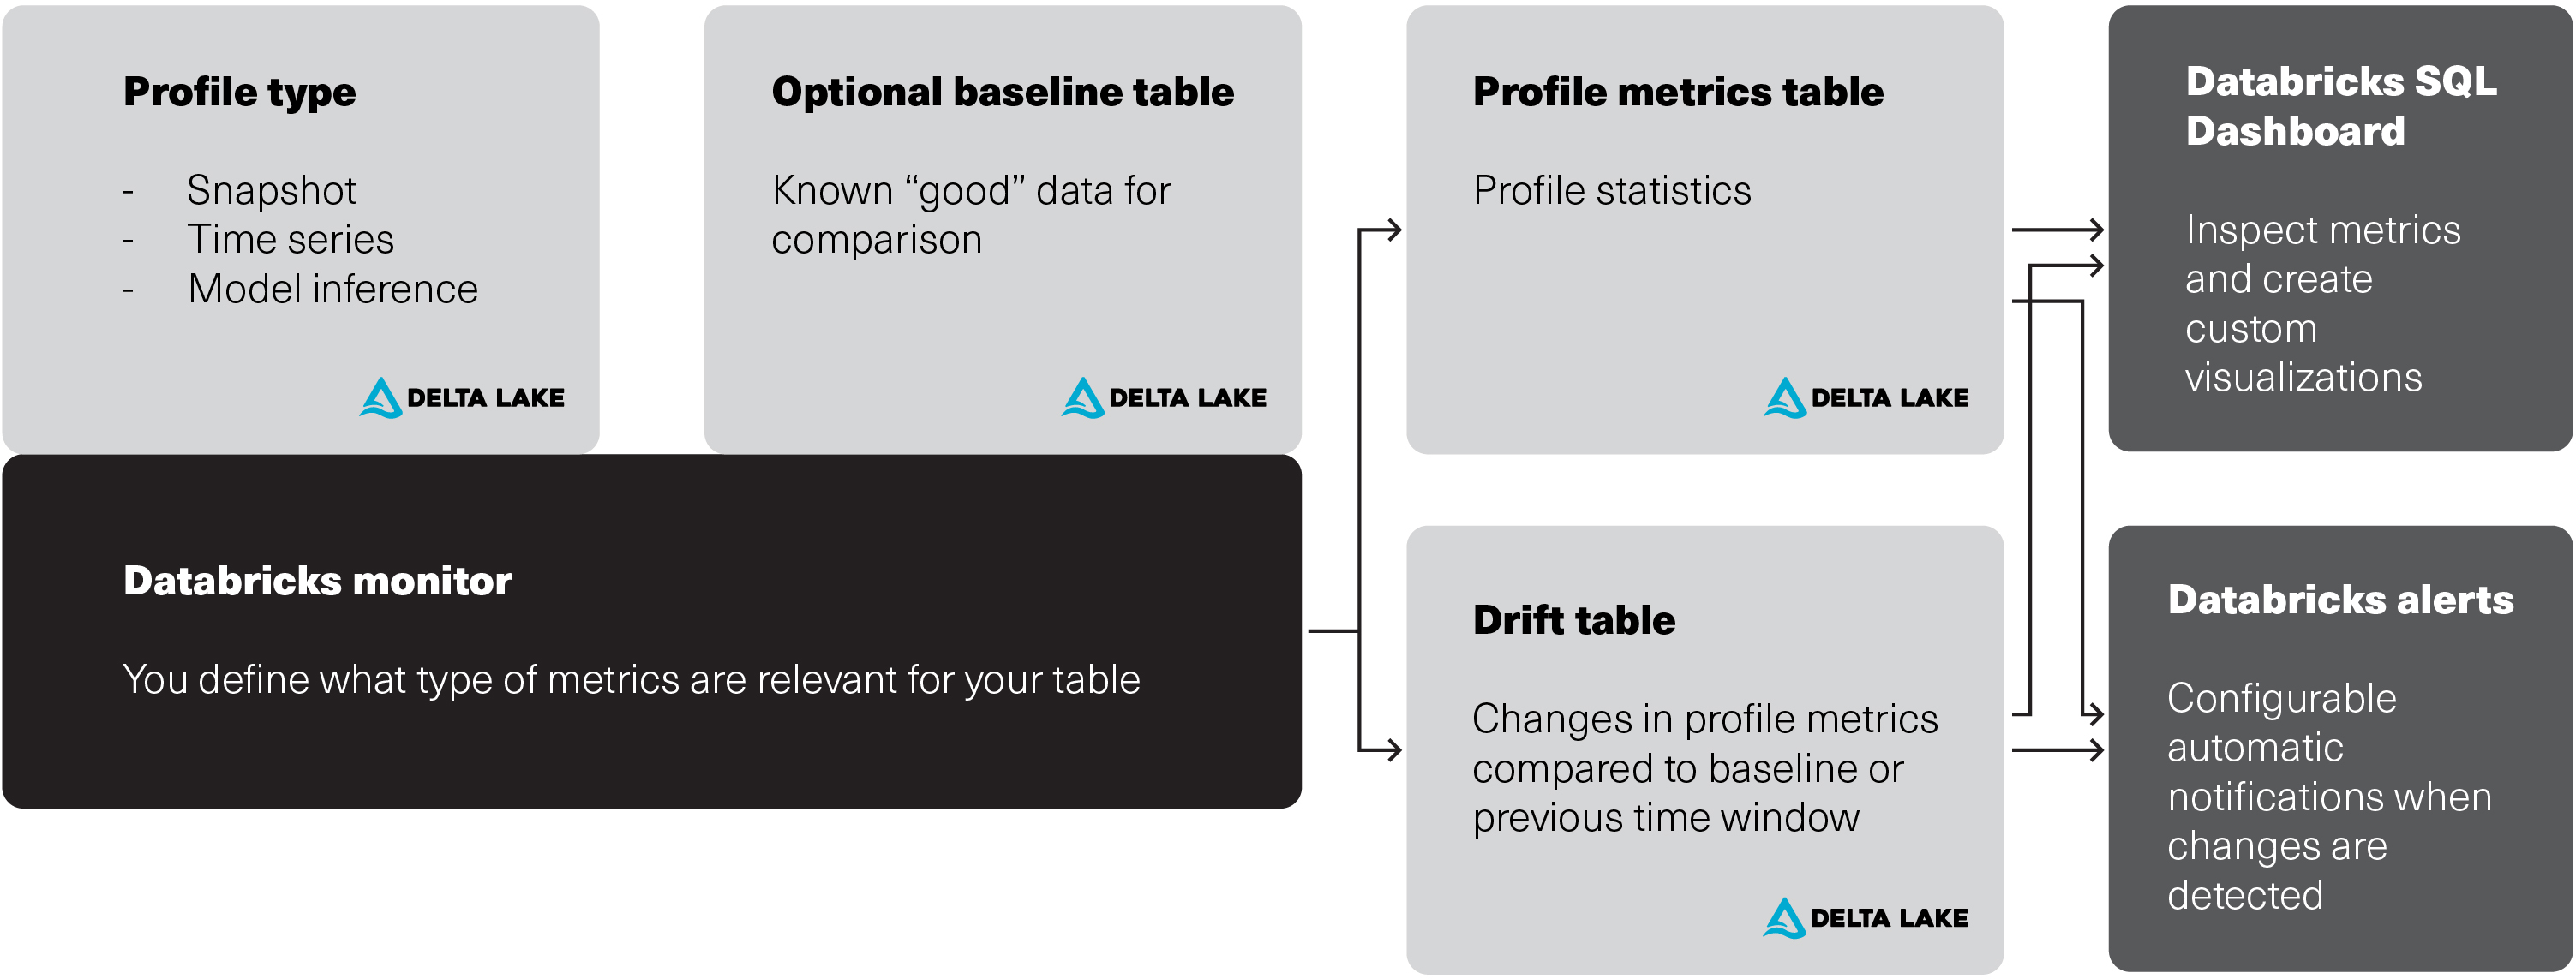
Source: Databricks
Relationship between Databricks Lakehouse Monitoring input tables, metric tables, monitor, and dashboard.
Lakehouse Monitoring only works for:
- Databricks Workspaces with Unity Catalog enabled
- Delta managed tables, external tables, views, materialized views,* and streaming tables*
- Users with Databricks SQL access
- Serverless compute
*Incremental processing isn’t supported for this monitor
Why Monitor Data Quality for Data Pipelines and AI/ML Models?
Before data is usable in AI/ML models and engineering pipelines, it must be accurate and trustworthy. Simply put, the reliability of AI/ML models is directly contingent on the quality of the data used, making it imperative for MLOps teams to understand the quality of data feeding their models.
By setting up metrics to actively monitor data pipelines and AI/ML models in Databricks, MLOps and data teams can validate and track the changes in Data Quality over time to understand data distribution shifts and AI/ML model reliability.
Lightup Deep Data Quality Metrics
Now that we’ve walked through an overview of Lakehouse Monitoring, let’s see where Lightup fits in by comparing some notable features and functionalities.
Lightup offers a full range of metrics, divided into four categories:
- Column metrics answer questions about specific columns, with the widest variety of configuration options.
- Comparison metrics enable data comparisons across different tables (directly or through comparable metrics)
- Table metrics provide basic information about table health, including metadata checks.
- Custom SQL metrics help answer business-specific questions about data.
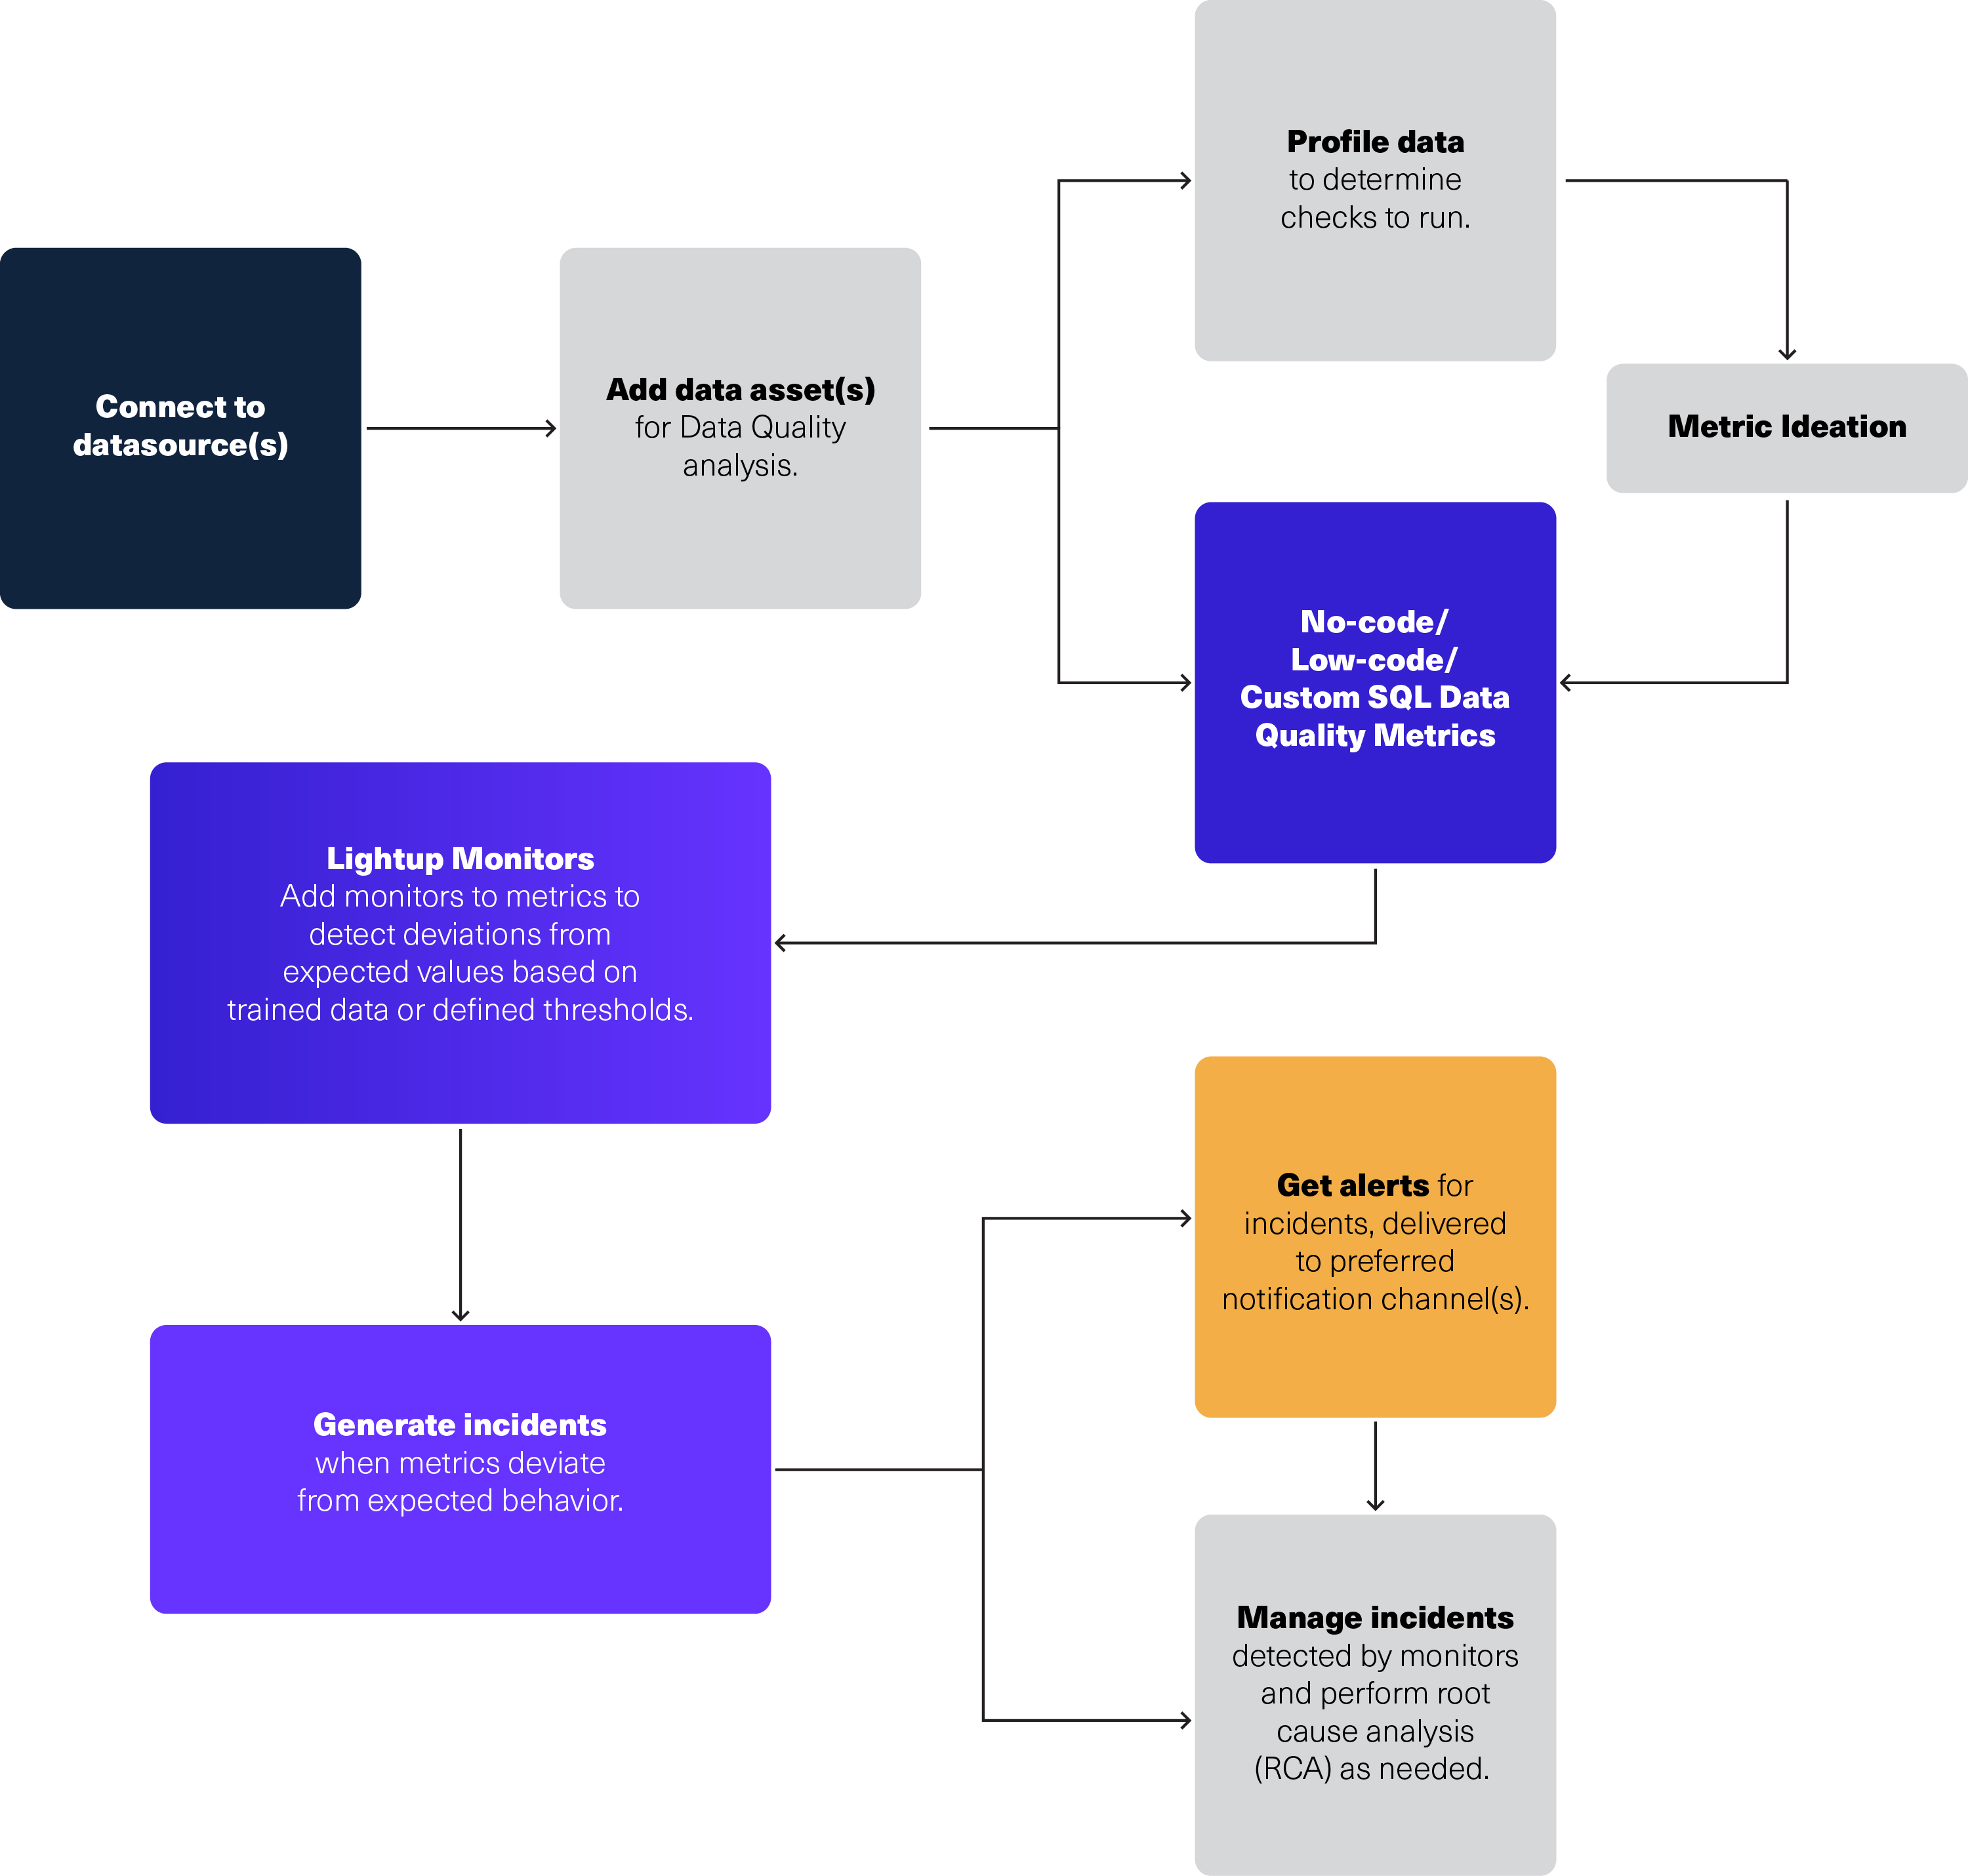
Here’s a short demo to walk you through how Lightup works.
Proactive Monitoring and Remediation
Lightup: Proactively monitors huge volumes of data across data sources with a rich set of capabilities for basic and power users alike. Metric collection can be scheduled in Lightup, triggered by the data pipeline’s ETL flow or run on a cron-based custom schedule.
With integrated incident remediation and root cause analysis (RCA) workflows, data teams can easily triage incidents in Lightup for faster troubleshooting. To accelerate incident remediation and root cause analysis, Lightup provides a Failing Records query that allows you to analyze up to 10,000 failing records. Plus, Lightup automatically generates the exact query to run to find all the failed records in Databricks.
Lakehouse Monitoring: A new native Databricks feature, offering real-time monitoring and remediation capabilities for engineering pipelines and AI/ML models within a single data store.
Lakehouse Monitoring also provides lineage graphs with monitor alerts, indicating the problematic table and impacted upstream tables to help identify issues and accelerate problem-solving.
Data Source Compatibility
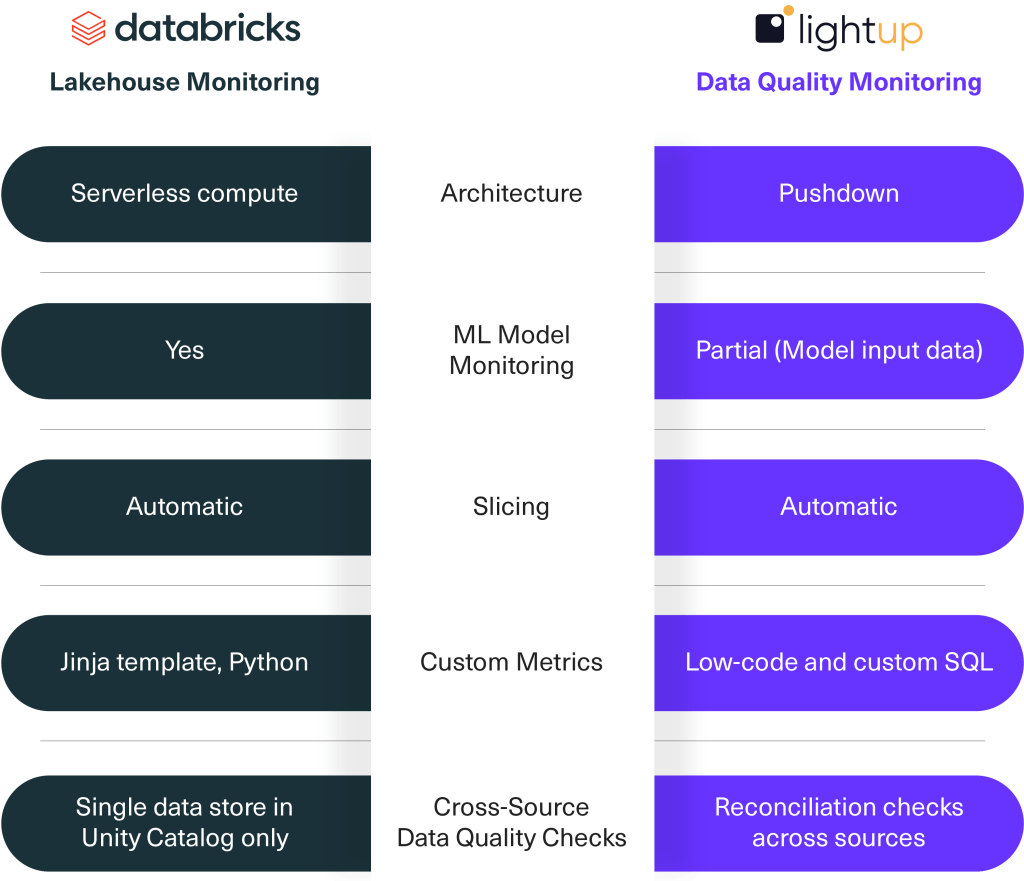
Lakehouse Monitoring: Requires Unity Catalog and is targeted at organizations invested in monitoring single data stores or datasets within Unity Catalog only, limiting its effectiveness and flexibility for those requiring Data Quality Monitoring coverage outside of Databricks.
Lightup: Designed to work seamlessly with virtually any data source, enabling organizations with a modern data stack to address Data Quality issues without toggling between different data source-specific query syntax and coding requirements.
Slicing
Lightup: Automatically slice metrics into smaller subsets on the fly by simply selecting the column name in a drop-down menu, without writing individual checks for every slice.
Lakehouse Monitoring: Manually enter the slicing expression or name of each column to slice by when creating a monitor for a table.
Custom Metrics
Lightup: Tailored for both technical and non-technical users, Lightup democratizes Data Quality with prebuilt no-code and low-code checks, making it easy for anyone to write their own Data Quality Checks — without relying on data engineers.
Creating custom metrics is simple and fast with Lightup’s assisted SQL query builder. Business analysts and other SQL-fluent users can easily define an endless array of business-specific metrics without coding or learning a proprietary rule engine.
Lakehouse Monitoring: Requires expert knowledge of Databricks SQL, making it potentially more challenging for non-technical business users.
Creating custom metrics requires a Jinja template without joins or subqueries to specify how the SQL expression will compute the metric — making it less accessible for non-technical business users. Complex definitions require Python.
3 Custom Metrics
- Aggregate metrics: Calculations based on primary table columns; stored in profile metrics table
- Derived metrics: Calculations based on prior aggregate metric computation, not directly from data in primary table; stored in profile metrics table
- Drift metrics: Calculations compare computed aggregate or derived metrics from two time windows or between the primary and baseline tables; stored in drift metrics table
Cross-Source Data Quality Checks
Lightup: For enterprises using different data sources — such as Snowflake, AWS Redshift, Google BigQuery, SAP Hana, and more — at various stages of their data pipelines, Lightup supports advanced use cases like Reconciliation Checks across data sources. This powerful check allows data teams to compare data from different tables and identify issues in the pipeline as data moves from one stage to another.
Being able to run Reconciliation Checks to compare row-by-row data from different data sources is especially critical for Cloud migrations and data pipeline validation.
As more and more enterprise organizations are “shifting left” to identify Data Quality issues as early as possible in the data life cycle, having the power of a specialized solution like Lightup is crucial to implementing this strategic shift.
Lakehouse Monitoring: Focuses on monitoring the quality of data within a single data store in Unity Catalog only, lacking the ability to run checks that join data from different tables or reconcile data across disparate sources.
Monitoring Data Quality Across Your Data Stack with Lightup
MLOps teams can use Lakehouse Monitoring in Databricks as a convenient way to monitor Databricks pipelines and AI/ML models. But many enterprise organizations typically have complex modern data stacks with multiple data warehouses, transactional databases, Data Governance and Catalog platforms, and/or other data lakes with metastores.
If you’re looking for a programmatic and comprehensive approach to monitoring the quality of data across the entire modern data stack, there’s Lightup.
With user-friendly no-code/low-code Data Quality Checks, Lightup is compatible with diverse data sources and has a proven record for addressing complex, business-specific Data Quality challenges for large Fortune 500 enterprises. When you need to monitor enterprise data that combines Databricks and other data sources, Lightup provides comprehensive coverage with integrated AI-powered Anomaly Detection, Incident Alerts, and Remediation workflows that connect to your current processes across the data stack.
We encourage you to explore Databricks Lakehouse Monitoring and send us any questions about how Lightup provides comprehensive Data Quality Monitoring coverage to meet the needs of your data environment.
Resources
On-demand Demo: “Off the Shelf Data Quality Checks on Databricks Using Lightup”
Need help narrowing down Data Quality options? Download our free Buyer’s Guide Worksheet, available in our blog, “10 Essential Questions for Choosing a Data Quality Monitoring Tool.”
Questions? Contact us or request a free strategy session and demo today.