How to Build Data Quality Dashboards with Lightup Metrics and Your Favorite BI Tools
Saurabh
May 2, 2025
If you care about Data Quality reporting for broader transparency at your organization, you need custom dashboards. Whether you’re tracking data freshness, schema changes, or incidents, creating Data Quality dashboards is the best way to report usage, trends, and visually summarize insights by product or department for stakeholders and executive leadership teams.
Lightup provides built-in Data Quality dashboards for at-a-glance insights that matter most to your team.
Lightup provides built-in Data Quality Dashboards summarizing key insights and health scores.
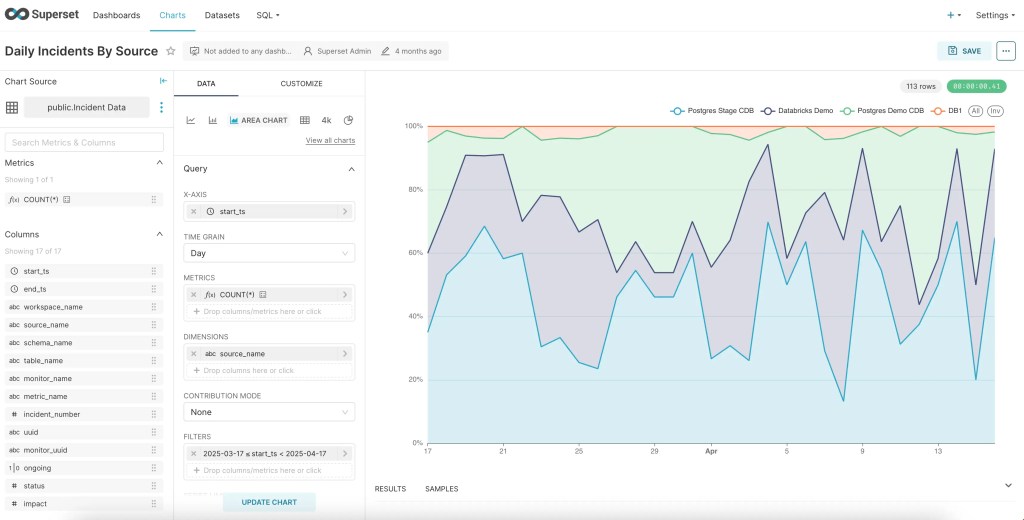
For organizations that prefer to use their enterprise BI tool, Lightup enables teams to build executive reports and custom dashboards with PowerBI, Tableau, Apache Superset, and more.
Sample Supersets chart showing daily incidents by source, fed by Lightup metrics.
Creating Data Quality Dashboards with Lightup Metrics
By design, Lightup focuses on being as flexible as possible, which is why we expose our data model directly in Postgres. That means if your BI tool can connect to Postgres, you’re ready to start building custom Data Quality dashboards for your organization — no extra data modeling required.
Get started by connecting your BI tool to Lightup’s Postgres database, where you’ll get direct access to an analytics view of key Lightup metrics, such as:
Daily incident counts by data source
Failing records count
Number of incidents
Names of metrics and monitors
Status of active monitors
Count by product or department
This isn’t just a view of raw data in Postgres; Lightup exposes a structured, dashboard-ready schema, so you can easily map fields to your BI tools for visual exploration and reporting.
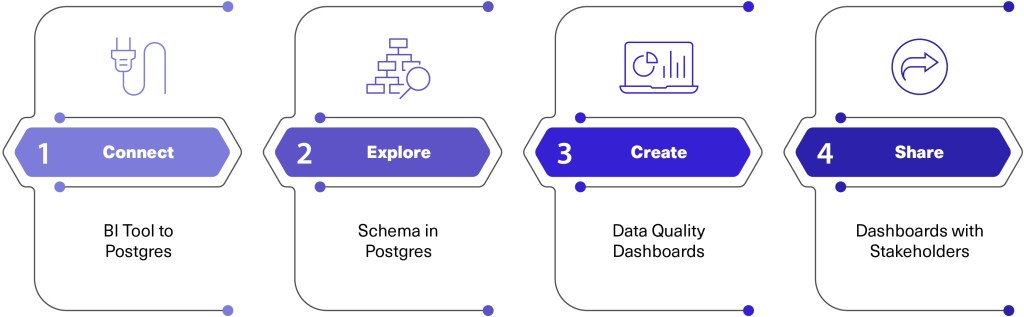
Customizing Data Quality dashboards with Lightup metrics is simple:
Connect your BI tool to Lightup’s Postgres database.
Explore the exposed schema.
Create charts and dashboards based on your business requirements.
Share dashboards with stakeholders for ongoing visibility and decision-making.
Why It Matters
If you’re ready to enhance Data Quality reporting at your organization with customized dashboards, Lightup enables faster time-to-insight by providing:
A live data model in Postgres, ensuring up-to-date Data Quality dashboards.